

Airline ticket prices had a pretty significant drop last year, but have started to rise again this year. Cost isn’t all that matters when picking what company to fly with, though. Comfort and safety also matter, especially with recent incidents in the news about plane malfunctions.
Finding the most affordable airfare is now quite easy for anyone with an internet connection, so this report examines other, overlooked aspects of air travel to help consumers make more-informed decisions.
WalletHub compared the 9 largest U.S. airlines, plus one regional carrier, across 13 important metrics. They range from cancellation and delay rates to baggage mishaps and in-flight comfort. We also considered costs in relation to in-flight amenities for the sake of fairness. For example, it wouldn’t be right to penalize an airline that charges for drinks if its tickets are far cheaper than those from an airline with free in-flight refreshments.
2024’s Best Airlines
| Category | Airline |
|---|---|
| Best Airline Overall | Alaska Airlines |
| Most Affordable Airline | Spirit Airlines |
| Most Reliable Airline | Delta Air Lines |
| Most Comfortable Airlines | Delta Air Lines and JetBlue Airways |
| Safest Airline | Spirit Airlines |
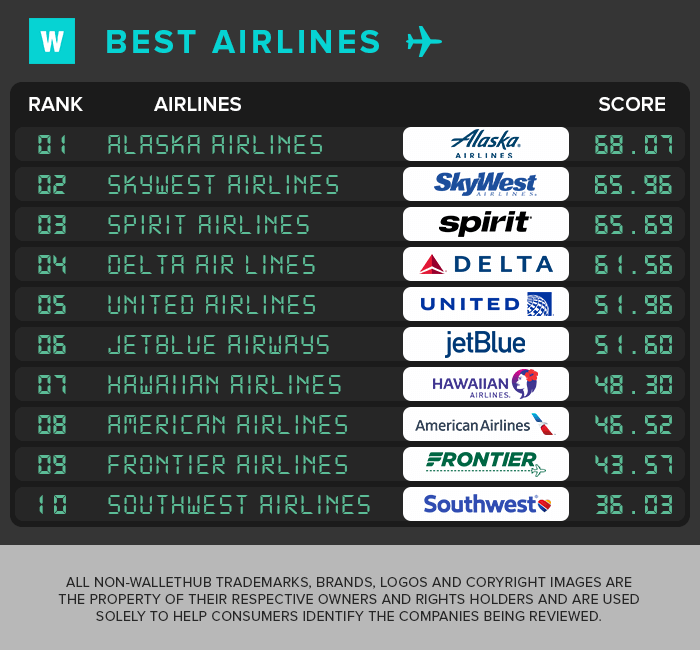
Below, you can see where each major airline ranks, based on overall WalletHub Score.
Key Findings
Most Reliable Airline: Delta Air Lines has the lowest rate of cancelations, delays, mishandled luggage and denied boardings.
Most Comfortable Airlines: Delta Air Lines along with JetBlue Airways leads the pack in terms of in-flight experience, offering free amenities such as Wi-Fi, extra legroom, and complimentary snacks and beverages.
*The regional carrier SkyWest is not represented in this chart because it serves other major airlines, which may dictate what amenities are provided.
Most Affordable Airline: Spirit Airlines is the best airline for budget flyers.
*Reflects passenger revenue per available seat mile (PRASM), obtained by dividing passenger revenue by the product of the number of available seats and the number of miles flown.
Safest Airline: Spirit Airlines is the safest in 2024. The safety runner-up is Alaska Airlines.
Detailed Scores
The tables below illustrate the number of points that each airline received based on the scoring system defined in the methodology.
National Airline Scores
| Metric | Max Score | Alaska Airlines | Spirit Airlines | Delta Air Lines | United Airlines | JetBlue Airways | Hawaiian Airlines | American Airlines | Frontier Airlines | Southwest Airlines |
|---|---|---|---|---|---|---|---|---|---|---|
| Canceled Flights | 8.00 | 5.21 | 5.74 | 4.49 | 3.61 | 2.45 | 0.24 | 7.29 | 0.00 | 6.56 |
| Delays | 18.00 | 9.15 | 5.11 | 9.53 | 7.69 | 0.10 | 2.02 | 5.45 | 0.00 | 5.09 |
| Mishandled Baggage Reports | 9.00 | 0.17 | 6.03 | 3.38 | 1.14 | 4.70 | 2.48 | 0.00 | 5.95 | 1.31 |
| Denied Boardings | 15.00 | 13.86 | 6.94 | 15.00 | 14.54 | 13.31 | 14.89 | 5.17 | 0.00 | 11.72 |
| Leg Room | 2.00 | 2.00 | 0.00 | 2.00 | 2.00 | 2.00 | 2.00 | 2.00 | 0.00 | 2.00 |
| Entertainment Options | 1.00 | 1.00 | 0.00 | 1.00 | 1.00 | 1.00 | 1.00 | 1.00 | 0.00 | 1.00 |
| Wi-Fi Availability | 1.00 | 0.63 | 0.50 | 1.00 | 0.50 | 1.00 | 0.00 | 0.63 | 0.00 | 0.63 |
| Complimentary Refreshments | 1.00 | 1.00 | 0.00 | 1.00 | 1.00 | 1.00 | 1.00 | 1.00 | 0.00 | 1.00 |
| Price | 10.00 | 3.02 | 8.30 | 0.27 | 0.48 | 2.97 | 2.95 | 0.00 | 7.69 | 2.21 |
| Fatal Injuries in Aviation Accidents | 12.00 | 12.00 | 12.00 | 12.00 | 12.00 | 12.00 | 12.00 | 12.00 | 12.00 | 0.00 |
| Injuries in Aviation Incidents & Accidents | 12.00 | 12.00 | 12.00 | 8.00 | 8.00 | 8.00 | 8.00 | 8.00 | 12.00 | 0.00 |
| Aviation Incidents & Accidents | 6.00 | 3.04 | 4.07 | 3.89 | 0.00 | 3.06 | 1.73 | 3.98 | 0.94 | 4.52 |
| Fleet Age | 5.00 | 5.00 | 5.00 | 0.00 | 0.00 | 0.00 | 0.00 | 0.00 | 5.00 | 0.00 |
| Final Score | 100.00 | 68.07 | 65.69 | 61.56 | 51.96 | 51.60 | 48.30 | 46.52 | 43.57 | 36.03 |
Regional Airline Scores (1)
| Metric | Max Score | SkyWest Airlines |
|---|---|---|
| Mainly Serves | N/A | American, Delta, Alaska and United |
| Canceled Flights | 8.00 | 7.88 |
| Delays(3) | 18.00 | 8.62 |
| Mishandled Baggage Reports | 9.00 | 0.93 |
| Denied Boardings | 15.00 | 11.45 |
| Leg Room | 2.00 | 2.00 |
| Entertainment Options(2) | 1.00 | 0.00 |
| Wi-Fi Availability(2) | 1.00 | 0.50 |
| Complimentary Refreshments(2) | 1.00 | 1.00 |
| Price | 10.00 | 4.94 |
| Fatal Injuries in Aviation Accidents | 12.00 | 12.00 |
| Injuries in Aviation Incidents & Accidents | 12.00 | 12.00 |
| Aviation Incidents & Accidents | 6.00 | 4.64 |
| Fleet Age | 5.00 | 0.00 |
| Final Score | 100.00 | 65.96 |
(1) Regional airlines that serve other major airlines. There are more regional carriers serving the national airlines, but this is the only one required to report to the DOT and that has at least 1 percent of total domestic scheduled-service passenger revenues.
(2) Depending on the major airline served, flights from this airline may or may not provide the service. Please see Methodology for scoring.
(3) There may be discrepancies caused by variations in how airlines code the delay data that they report to the DOT.
Ask the Experts
Airline travel is essential for business, vacation, migration and so many other aspects of society. Airlines have increasing pressure to provide comfortable, convenient service to their passengers. To gain further insight on this topic, WalletHub turned to a panel of experts. Click on the experts to see their bios and responses to the following key questions.
- What measures can airlines undertake in order to diminish their pilot shortage?
- What would be the easiest measures to be implemented by airlines in order to increase passenger comfort?
- Is there an easy measure to be implemented by the airlines so that congestions at the counter could be reduced?
- Which do you believe will be the main trend for the medium term in the airline industry? Will we see consolidation or the rise of regional players?
- Is inflation affecting the airline industry?
Ask the Experts

Ph.D., C.M. – Ronald W. Collins Distinguished Faculty; Assistant Professor & Program Coordinator; Aviation Management Technology Program, GameAbove College of Engineering & Technology, Eastern Michigan University
Read More

MS, ATP, CFI/AIM – Clinical Assistant Professor, School of Aviation and Transportation Technology, Aviation Technology Center – Purdue University
Read More

Assistant Professor, College of Aeronautics – Lynn University
Read More

Assistant Professor of Teaching in Management, Mike Ilitch School of Business – Wayne State University
Read More

Department Chair, Department of Professional Aviation, College of Liberal Arts – Louisiana Tech University
Read More

Continuing Lecturer: Certified Flight Instructor – Purdue University - Purdue Polytechnic Institute
Read More
Methodology
In this report, we sought to supplement easily accessible price-comparison tools by identifying the best and worst airlines in terms of overall service quality and functional performance. To this end, we evaluated the 9 largest national airlines as well as one regional carrier (that report to the Department of Transportation because they have at least 1 percent of total domestic scheduled-service passenger revenues) in terms of 13 key metrics across three major categories: 1) Baggage and departures, 2) In-flight comfort and cost and 3) Safety.
After collecting and analysing 2023 flight data from the U.S. Department of Transportation, we shared our findings with each airline.
You can find the detailed scoring framework used to evaluate each airline below. Each metric within this framework was assigned a given number of points based on our subjective view of its importance and we also determined the best and worst value within each metric. We generally allocated points based on common sense, with the best value for each metric being awarded full points, the worst value receiving zero points and values in between receiving a proportional score relative to those endpoints, except for the metrics where a different scoring method is specified.
- Baggage and Departures (Total Score: 50 points)
-
- Canceled Flights (Max Score: 8 points)
We collected the number of reported flight cancellations by each airline, then excluded any weather, security and National Aviation System related cancellations, as they are not carrier-specific. We then divided the resulting figure by the corresponding number of regularly scheduled flights (excluding uncontrollable causes) to obtain the overall percentage of cancelled flights. Ranges used for scoring are Best = 0.00%, Worst = 1.29%, with best receiving the most points and worst receiving the least.
-
- Delays (Max Score: 18 points)
We identified the number of each airline’s flights that were delayed by more than 15 minutes, excluded weather, security and National Aviation System related delays, and divided the resulting figure by the total number of regularly scheduled flights (excluding uncontrollable causes) to obtain each airline’s delayed-flight percentage. Ranges used for scoring are Best = 1.00%, Worst = 24.33%, with best receiving the most points and worst receiving the least.
-
- Mishandled Baggage Reports (Max Score: 9 points)
We used the total number of mishandled (i.e. lost, damaged, delayed or pilfered) baggage reports received by each airline to determine the rate of mishandled baggage per 1,000 enplaned passengers. Ranges used for scoring are Best = 0.50, Worst = 3.95, with best receiving the most points and worst receiving the least.
-
- Denied Boardings (Max Score: 15 points)
We determined how many passengers with confirmed reservations were involuntarily denied boarding oversold flights on each airline. We then used this number to arrive at the rate of involuntary denied boardings per 10,000 passengers for each airline. Ranges used for scoring are Best = 0.00, Worst = 0.70, with best receiving the most points and worst receiving the least.
- In-Flight Comfort and Cost (Total Score: 15 points)
- Leg Room (Max Score: 2 points)
- If all of an airline’s flights provide at least 30 inches of leg room in economy class/coach seats = Full points
- If all of an airline’s flights do not provide at least 30 inches of leg room in economy class/coach seats = No points
- Entertainment Options (Max Score: 1 point)
- If the airline provides some form of entertainment option (e.g. movies, live TV or radio) on most of its flights = Full points
- If the airline does not provide entertainment options on any or most of the airplanes in its fleet = No points
- Wi-Fi Availability (Max Score: 1 point)
- If the airline provides free Wi-Fi on most of its flights = Full points
- If the airline provides limited free Wi-Fi on most of its flights = 0.625 points
- If the airline provides Wi-Fi for a cost on most of its flights = 0.5 point
- If the airline does not provide Wi-Fi on most of its flights = No points
- Complimentary Refreshments (Max Score: 1 point)
- If the airline provides both free food and drinks on all domestic flights over 2 hours = Full points
- If the airline provides either free food or free drinks on all domestic flights over 2 hours = 0.5 points
- If the airline does not provide free food or drinks on all domestic flights over 2 hours = No points
- Price (Max Score: 10 points)
- We collected “Passenger Revenue per ASM,” defined as passenger revenue divided by available seat miles, for each airline. We then defined the best and worst as follows: best = 3 cents, worst = 16.15 cents.
- Safety (Total Score: 35 points)
-
- Number of Fatal Injuries in Aviation Accidents (2018-2023) (Max Score: 12 points)
- Airlines with no fatalities reported due to aircraft related issues = Full Points
- Airlines with 1 or more fatalities reported due to aircraft related issues = No Points
- Number of Injuries in Aviation Incidents & Accidents (2018-2023) (Max Score: 12 points)
- Number of Fatal Injuries in Aviation Accidents (2018-2023) (Max Score: 12 points)
We applied the following scoring criteria:
-
-
- If there were no injuries sustained by passengers and/or aircraft personnel that required medical care = Full points
- If there were under 15 injuries sustained by passengers and/or aircraft personnel that required medical care = 1.5 points
- If there were between 15 and 50 injuries sustained by passengers and/or aircraft personnel that required medical care = 1 point
- If there were more than 50 injuries sustained by passengers and/or aircraft personnel that required medical care = No points
- Number of Aviation Incidents & Accidents per Total Number of Flight Operations (2018-2023) (Max Score: 6 points)
-
For each airline, we divided the number of incidents and accidents by the total number of flight operations. We applied the following scoring criteria:
-
-
- Full Points = 0 (the closer to 0 an airline’s adjusted incident ratio was, the more points it received)
- No Points = The airline with the lowest ratio based on the calculation mentioned above
-
For the metrics a., b. and c. we also included data from preliminary reports.
-
- Average Fleet Age (Max Score: 5 points)
An older fleet is more vulnerable to technical glitches and operational mishaps.
We applied the following scoring criteria:
-
- Average fleet age under 10 years = Full points
- Average fleet age between 10 and 15 years = 1 point
- Average fleet age exceeds 15 years = No points
The regional airline considered in this report – namely, SkyWest – serves more than one major airline and may or may not offer certain services mentioned under in-flight comfort, depending on the major airline served for a particular flight. In such case, we used the average of the maximum and minimum potential scores for each situation to calculate the final score received. Data is accurate as of April 17, 2024.
WalletHub experts are widely quoted. Contact our media team to schedule an interview.